Two key risk ratios just hit extremes: Consumer Staples has broken to fresh lows against the S&P 500, while Equal-Weight Discretionary has hit record highs relative to Staples.
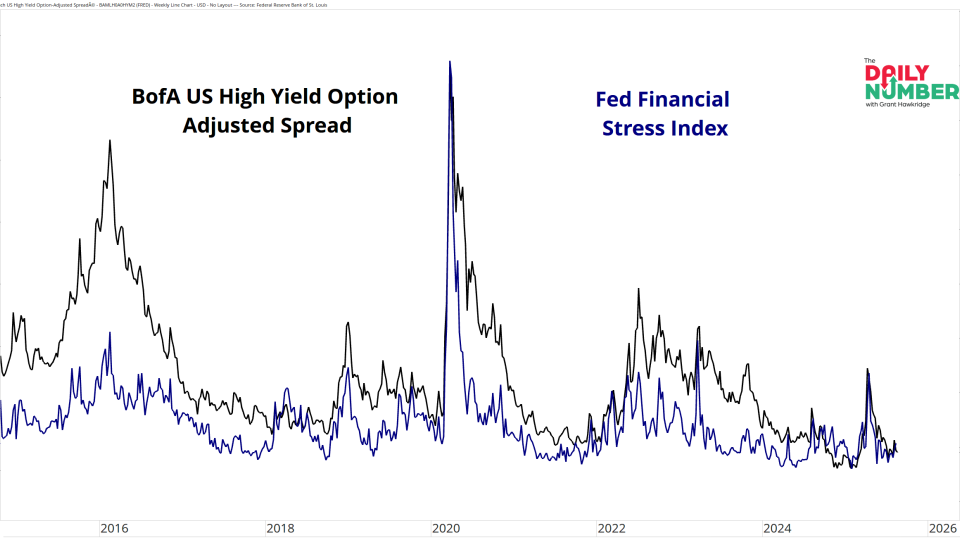
These are two key stress metrics I follow — the BofA US High Yield Option-Adjusted Spread and the St. Louis Fed Financial Stress Index — and they’re near their lows, telling me there’s not...